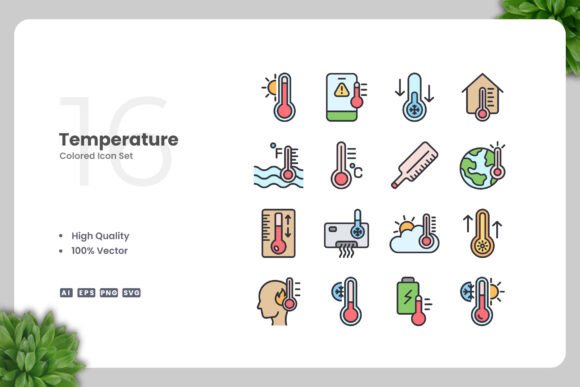
Designing with Temperature Colored Icons: Communicating Meaning Through Visual Heat and Cool
In the crowded visual landscape of digital and print media, icons have become a universal shorthand for complex ideas. They transcend language, speed up recognition, and add polish to any design. But not all icons are created equal. A growing trend among designers, educators, and business owners is the use of Temperature Colored Icons — a system where color palettes are intentionally mapped to thermal cues to convey mood, status, or data intensity. This approach turns a simple graphic into a communication tool that feels intuitive and immediate.
Rather than relying on arbitrary color choices, temperature-colored icons use hues that humans naturally associate with heat and cold — warm reds, oranges, and yellows for hot states, and cool blues, greens, and purples for cold ones. This alignment with human perception means that viewers often understand the icon's message without needing to read a single word. For creators working across websites, mobile apps, books, social media, infographics, flyers, banners, posters, and more, this design strategy offers a clean, scalable way to layer meaning into visual assets.
The Psychology Behind Warm and Cool Icon Palettes
Human beings are wired to respond to temperature cues. From a young age, we learn that red can mean hot, danger, or urgency, while blue suggests calm, cold, or safety. When these associations are translated into icon design, the result is a visual language that feels almost instinctive. Temperature Colored Icons tap directly into this perceptual shortcut, making them especially effective for interfaces where quick comprehension matters — think weather apps, climate dashboards, medical monitoring tools, or even e-commerce filters for product categories like "spicy" or "cooling."
Consider a fitness tracker icon set: a flame icon in warm orange instantly communicates calories burned or intensity, while a snowflake in pale blue signals rest or low activity. No text is needed. This same logic extends to dashboard indicators, progress bars, and even social media reaction buttons. The palette itself becomes part of the message, not just decoration. For designers who want to reduce cognitive load while maintaining visual appeal, temperature-mapped color choices are a practical, evidence-based solution.
Why Vector Format Matters for Temperature-Colored Icon Systems
One of the most important decisions when adopting any icon set is the file format. Raster images may look fine at a fixed size, but they quickly become pixelated when scaled or edited. Temperature Colored Icons delivered as vectors — especially in formats like AI, EPS, and SVG — solve this problem completely. Vectors are resolution-independent, meaning they stay crisp whether you're placing them on a social media thumbnail or blowing them up for a poster at 300 DPI.
Beyond sharpness, vectors offer unparalleled flexibility for color adjustments. Because temperature-colored designs rely on precise hue mapping, you may need to shift a palette slightly to match a brand guideline or improve contrast for accessibility. With vector files, you can open the icon in software like Adobe Illustrator or CorelDRAW and adjust each color individually without degrading the artwork. This level of control ensures that your icons remain consistent across every application — from mobile app screens to printed flyers to large-format banners.
Core Characteristics of High-Quality Temperature-Colored Icon Sets
Not all temperature-colored icon packs are built the same. When evaluating a set for professional use, several characteristics stand out as essential:
- High Quality Design — Each icon should be carefully drawn with balanced proportions, clear silhouettes, and consistent stroke weights. The thermal color mapping should feel natural, not forced.
- 100% Vector — Every element must be fully vector-based. This ensures that scaling, recoloring, and editing remain possible without quality loss.
- 100% Customizable — The best sets allow you to modify colors, resize components, and combine icons freely. You should never feel locked into a preset combination.
- Easy Drag and Drop — Whether you're a seasoned designer or a business owner formatting a flyer, the icons should be ready to use straight out of the folder, with no complicated setup.
One example of a well-structured package includes source files such as AI (Adobe Illustrator), EPS version 10 (widely compatible with CorelDRAW and older software), SVG (perfect for web and app interfaces), and PNG with transparency (convenient for quick placement in documents or presentations). A Readme.txt file usually accompanies the set, offering guidance on installation and usage — a small but thoughtful touch that saves time for busy professionals.
Real-World Applications Across Media Types
The versatility of temperature-colored icons is one of their strongest selling points. Because the design is clean and the color logic is universal, they can be deployed across an unusually wide range of contexts:
Websites and Mobile Apps
Digital interfaces benefit enormously from icons that communicate state. A temperature-colored gauge can show server load, user engagement, or risk level at a glance. For e-commerce sites, warm-colored icons can highlight limited-time offers or trending items, while cool ones denote standard inventory or recommended but less urgent products. The simplicity of the design ensures fast loading and crisp rendering on Retina displays.
Books and Editorial Design
In educational or instructional books, temperature-colored icons help readers quickly locate key information. A heat map icon in warm tones might signal a "hot tip" or warning, while a cool icon indicates a supplementary note or reference. Because vector files print cleanly at any size, they are ideal for both print-on-demand and offset printing workflows.
Social Media Graphics and Infographics
Social media feeds are cluttered, and attention spans are short. Temperature-colored icons stand out because they use color contrast that feels purposeful rather than random. An infographic about climate data, for instance, gains instant credibility when rising temperatures are represented by a gradient of warm icons and declining trends by cool ones. The visual pattern reinforces the narrative without requiring extra text.
Flyers, Banners, and Posters
For promotional materials, the clean design of temperature-colored icons prevents visual noise. A fitness studio flyer can use a bright orange fire icon for "high intensity" classes and a blue water drop for "low impact" sessions. The color coding helps potential members scan the schedule in seconds. Because the icons are vector, they can be resized to fit a small flyer or a large banner without any loss of clarity.
Workflow Efficiency: From Download to Final Design
One of the overlooked advantages of a well-organized icon set is how it streamlines the creative process. When you purchase or download a pack of Temperature Colored Icons with proper vector sources, your workflow becomes predictable and fast. Here's a typical sequence:
- Unzip the package — You'll find folders for each format. Open the AI or EPS file if you plan to customize colors in Illustrator or CorelDRAW.
- Drag and drop — For quick placement, simply drag the SVG or PNG file directly into your design software or document.
- Recolor as needed — Select the icon and adjust hue, saturation, or brightness. Since the file is fully vector, you can change the temperature palette to match your brand while preserving the thermal logic.
- Scale without worry — Resize to fit a mobile screen, a poster, or a billboard. The vector math keeps edges clean.
- Export for final use — Save as SVG for web, PNG for social media, or EPS for print. All paths remain editable for future revisions.
This simplicity is a major reason why hobbyists and professionals alike gravitate toward vector-based temperature-colored icon sets. You don't need to be a color theorist or a coding expert to use them effectively.
Considerations When Selecting a Temperature-Colored Icon Set
While the benefits are clear, there are a few considerations to keep in mind to ensure you choose the right set for your project:
- Colorblind accessibility — Temperature cues (warm vs. cool) are generally distinguishable for most color vision deficiencies, but it's wise to test your palette. Many vector tools allow you to preview how icons look under different accessibility simulators.
- Consistency of style — Look for sets where all icons share the same line weight, corner rounding, and level of detail. Mixing styles within the same project can feel disjointed.
- License clarity — Always check the license terms. Most commercial-friendly sets allow use in websites, apps, and print materials, but some restrict resale or redistribution of the raw files.
- File format completeness — Ensure the set includes at least AI, EPS, SVG, and PNG. Missing formats may force you to convert files, which can break editing capabilities or degrade quality.
How Temperature-Colored Icons Support Brand Storytelling
Beyond utility, these icons can become part of a brand's visual vocabulary. A logistics company might use warm-colored icons to represent "express shipping" and cool ones for "standard delivery." A healthcare app could use thermal mapping to indicate symptom severity — mild symptoms in cool blue, moderate in yellow, severe in red. This consistency builds trust because users learn to read the color language over time.
For creators who work across multiple platforms — say, a website, a mobile app, and printed brochures — using the same temperature-colored icons in every channel ensures a unified experience. The icons become a visual thread that ties the brand together. And because vector files are so easy to adjust, you can fine-tune the palette for each medium without starting from scratch. A slightly warmer red might pop better on a phone screen, while a deeper blue works on a matte brochure paper.
Practical Advice for Editing Temperature-Colored Icons in Vector Software
If you're new to working with vector icons, here are a few practical tips for using them in Adobe Illustrator or CorelDRAW:
- Use Global Colors — In Illustrator, convert your icon's colors to global swatches. This lets you update the entire set by changing one swatch, which is invaluable when testing different temperature palettes.
- Work with Layers — Keep each icon element on a separate, named layer. This makes it easy to isolate and recolor the "hot" and "cool" parts independently.
- Test on Different Backgrounds — Temperature-colored icons that look great on white may lose contrast on a dark background. Add a subtle stroke or shadow if needed, but keep the design clean.
- Export with Consistent Naming — When you're done editing, export your icons with clear filenames (e.g., "icon-fire-hot.svg" or "icon-snowflake-cold.png"). This saves time when you or a teammate needs to find them later.
Why Simplicity and Cleanliness Are Non-Negotiable
The clean, simple design philosophy behind temperature-colored icons is not just aesthetic — it's functional. Overly complex icons confuse the thermal color mapping and reduce readability at small sizes. A minimalist approach ensures that the color does the heavy lifting. When every line and curve serves a purpose, the icon remains recognizable even when reduced to 16 pixels for a mobile tab bar or printed at 0.5 inches in a brochure.
This simplicity also makes the icons more versatile across different cultural contexts. While color associations can vary somewhat — for instance, white is associated with mourning in some cultures — the warm/cool dichotomy is nearly universal. Red and blue are understood across most of the world as hot and cold, respectively. That makes temperature-colored icons a safe and effective choice for global audiences.
Final Thoughts on Adopting Temperature-Colored Icons in Your Work
Whether you are a professional designer building a corporate dashboard, a small business owner creating social media content, or a teacher preparing an infographic for a classroom, temperature-colored icons offer a rare combination of clarity, beauty, and practicality. Their vector nature means they scale infinitely, their color logic taps into human instinct, and their clean design ensures they never feel dated or cluttered.
When you choose a set that includes high-quality source files — AI, EPS version 10, SVG, and PNG transparency — you gain the freedom to adapt the icons to any project without technical barriers. A simple drag-and-drop workflow, combined with the ability to edit every color and shape, puts professional-grade design power into anyone's hands. The result is visual communication that feels effortless, intuitive, and universally understood.
For creators who value efficiency, consistency, and impact, Temperature Colored Icons represent a smart, lasting investment. They work as hard as you do, across every medium, in every format, for every audience.
Upnowgraphic — Designed for clarity, built for versatility. High quality, 100% vector, fully customizable. Source files include AI, EPS version 10, SVG, PNG transparency, and a Readme.txt guide. Resize, recolor, and adapt with ease in Adobe Illustrator, CorelDRAW, or any vector editor. Suitable for websites, mobile apps, books, social media, infographics, flyers, print, banners, posters, and many more applications.