Pie Chart Colored Icons for Clear Data Communication
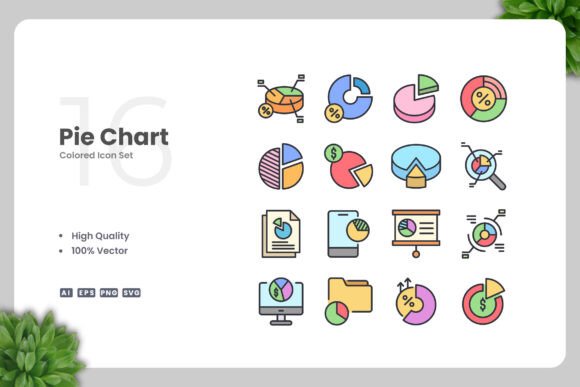
Data visualization plays a central role in how we share information today. Whether you are preparing a business report, designing a social media post, or building a dashboard for a mobile app, the visual elements you choose can either clarify your message or create confusion. Pie chart colored icons, when designed with clarity and simplicity, help audiences grasp proportions and comparisons at a glance. The Pie Chart Colored Icons set offers a practical, ready-to-use solution for anyone who needs clean, customizable visuals for data-driven projects.
Why Simple and Clean Design Matters for Pie Chart Icons
Icons that are overly detailed or inconsistent in style can distract from the data they are meant to represent. A pie chart icon should communicate the idea of parts of a whole without requiring the viewer to decode unnecessary ornamentation. The simple and clean design approach used in this set ensures that each icon remains legible at different sizes, from a small button on a website to a large graphic on a poster. This clarity supports faster comprehension, which is especially valuable when your audience is scanning content quickly on social media or in a printed flyer.
Another benefit of clean design is versatility. Icons with straightforward shapes and balanced color palettes integrate naturally into diverse layouts. You can place them alongside text, photographs, or other graphical elements without visual friction. For professionals who work across multiple platforms, this adaptability saves time and reduces the need to create custom assets for each medium.
Practical Benefits Across Use Cases
The Pie Chart Colored Icons set is not limited to one type of project. Its range of formats and customization options makes it suitable for a wide variety of applications.
Websites and Mobile Apps
User interfaces rely on icons to guide navigation and convey information efficiently. A pie chart icon on a dashboard or analytics page helps users instantly identify data sections. Because the icons are provided as vector files, you can resize them without losing quality, which is essential for responsive design. Whether you are working on a corporate website, a personal portfolio, or a mobile app for tracking expenses, these icons fit naturally into interface components like buttons, cards, or menu items.
Infographics and Data Presentations
Infographics combine visuals and text to tell a story with data. Using consistent, well-designed icons throughout an infographic makes the information more approachable. The colored pie chart icons can serve as visual anchors for different data points, helping readers quickly associate colors with categories. For presenters and educators, having a set of icons that can be edited in vector software means you can adjust colors to match your brand or topic without starting from scratch.
Print Materials: Flyers, Posters, Banners, and Books
Print projects demand high-resolution assets that maintain sharpness at various scales. The Pie Chart Colored Icons set includes vector formats such as AI, EPS, and SVG, which are ideal for print. You can use them in flyers promoting a service, posters for a conference, or banners for an event. The PNG files with transparency also give you flexibility when placing icons over colored backgrounds or images. For book publishers, these icons can illustrate concepts in educational or business titles without requiring complex custom illustration work.
Social Media Content
Social media posts that include visual data elements tend to attract more engagement. A pie chart icon can act as a supporting visual for a statistic in a LinkedIn post, an Instagram story, or a Facebook ad. Since the icons are easy to drag and drop into design tools, you can quickly assemble graphics that look polished and professional. The ability to change colors in software like Adobe Illustrator or CorelDRAW also lets you align the icons with your social media brand palette.
Customization That Saves Time and Expands Possibilities
One of the most practical aspects of this icon set is how easy it is to modify. Each of the 100 vector icons is fully customizable. You can resize them, change their colors, or combine them with other elements. This level of control is useful when you need to match a specific brand guideline or adapt the icons for a different context.
For example, a marketer preparing a quarterly report might want pie chart icons in company colors. Instead of searching for new icons or redesigning from scratch, they can open the AI or EPS file, adjust the fill colors, and export the result in minutes. Similarly, a freelance graphic designer working on multiple client projects can reuse the same set across different jobs by changing the visual treatment to suit each brand.
The files included cover the most common vector and raster needs:
- AI (Adobe Illustrator) – editable source file for deep customization
- EPS Version 10 – compatible with older and newer vector software
- SVG – web-friendly format that scales perfectly in browsers
- PNG with transparency – ready for quick use in presentations or social media
- Readme.txt – simple instructions to get started
Having multiple formats means you are not locked into one workflow. Whether your primary tool is Illustrator, CorelDRAW, Affinity Designer, or even a web-based editor, you can work with the format that fits best.
Who Benefits Most from This Icon Set
While the set is broadly useful, certain groups will find it particularly valuable.
Marketers and content creators who produce regular visual content for campaigns, reports, and social media can rely on the icons as a consistent resource. Instead of commissioning custom icons for each project, they have a library that covers a common data visualization need.
Educators and trainers who prepare handouts, slides, or online course materials will appreciate the clarity of the icons. Teaching data literacy or business concepts becomes easier when visual aids are clean and unambiguous.
Small business owners and entrepreneurs often handle their own design work. Having a set of professional icons that can be edited without technical skill reduces the barrier to creating polished marketing materials.
Freelancers and designers working with multiple clients can use the set as a reliable component in their toolkit. The vector files allow for rapid customization, which helps meet tight deadlines without sacrificing quality.
Publishers and authors producing books or e-books on business, finance, or analytics can insert these icons to illustrate concepts visually. The clean design ensures that the icons remain readable even in print at small sizes.
Bloggers and journalists who include data in their articles can use the icons to break up text and make statistics more digestible. The PNG format is especially convenient for quick placement in blog posts.
Considerations When Choosing Pie Chart Icons
No single icon set suits every possible need, and it is helpful to evaluate your specific requirements before selecting one. The Pie Chart Colored Icons set focuses on simplicity and broad applicability. If your project demands highly specialized icons, such as pie charts with specific 3D effects or extremely detailed illustrations, you might need to complement this set with additional assets. However, for the majority of use cases, the clean and simple approach supports clear communication without unnecessary visual noise.
Color choice is another factor. The icons come with preset colors that are designed to be visually balanced. If your brand uses a specific palette, you will need to invest a few minutes editing the vector files to match. This is straightforward in vector software, but if you prefer icons that already match your brand out of the box, you may want to check the color scheme first.
File format compatibility is generally excellent given the inclusion of AI, EPS, SVG, and PNG. If you work exclusively with a less common software that does not support these formats, you might need to convert the files. That said, EPS and SVG are widely supported across design tools.
How to Make the Most of This Icon Set
To get the best results, start by reviewing the icons in the set to understand the range of styles and variations available. Plan how you will use them across your project or content calendar. If you are building a brand kit, consider customizing the icons in advance so they are ready for repeated use.
When editing the files, keep the clean design principle in mind. Avoid adding too many details or decorations that might reduce legibility. The strength of these icons lies in their simplicity, so let the data speak. Use color intentionally to differentiate categories or emphasize key points.
For web and mobile use, export the SVG version to keep file sizes small and ensure crisp rendering on high-resolution screens. For print, use the AI or EPS files to output at the required resolution. The PNG transparency option is helpful for quick placements in tools that do not support vector files.
Final Thoughts
Visual communication is most effective when the tools you use are reliable, flexible, and easy to work with. The Pie Chart Colored Icons set delivers on these fronts by combining high-quality vector design with practical file formats and straightforward customization. Whether you are building a website, designing an infographic, creating social media content, or producing printed materials, having a clean set of pie chart icons saves time and improves the clarity of your message.
For professionals, creators, and business owners who frequently present data, this set offers a solid foundation. The ability to resize, recolor, and repurpose the icons across different projects means you invest once and benefit multiple times. As data continues to shape how we communicate, having clear visual assets like these becomes a small but meaningful advantage.